
Event Date
NOTE: This webinar was rescheduled. If you need assistance before this date, please contact [email protected]
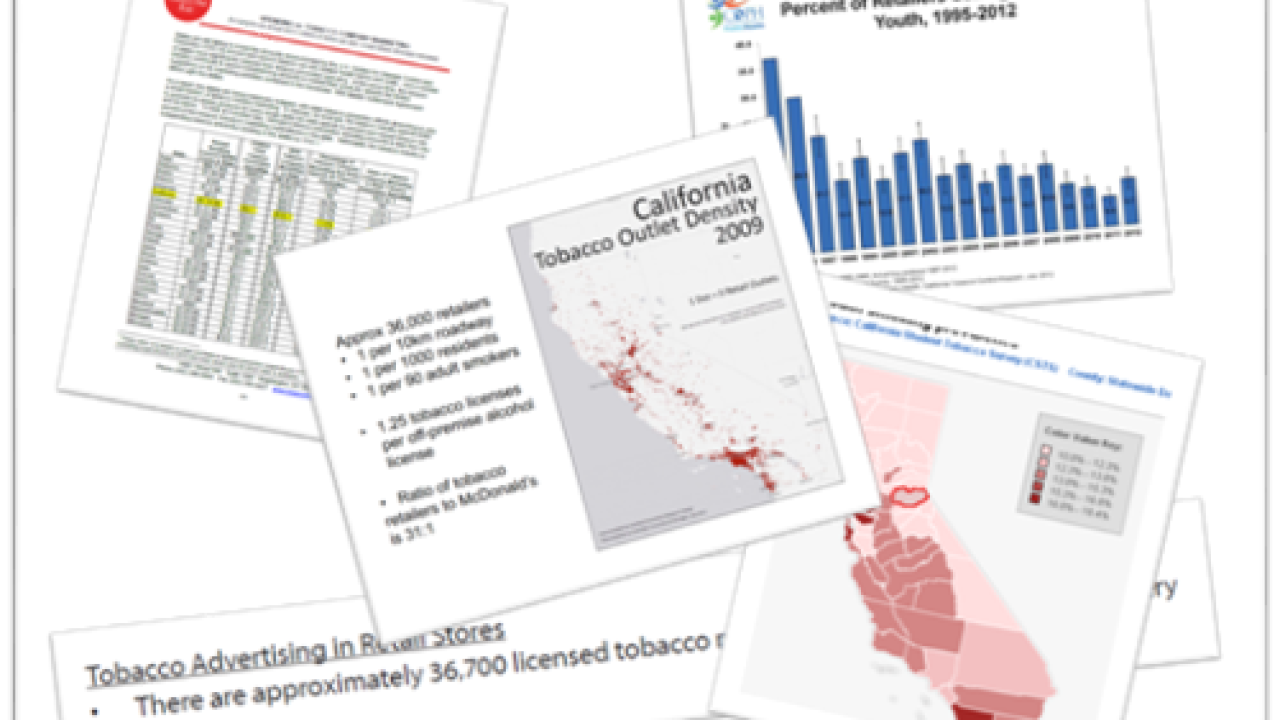
How can you go beyond the default bar chart and create data visualizations that are meaningful and impactful? In this session, we'll explore how to look for the relationships in your data, and how to use data visualization to best tell the story to your different audiences. We’ll walk you step-by-step through our process from survey results to selecting viz formats to develop the final product.
Join us for this follow-up to our two-part webinar on Data Analysis in Excel!
Register in advance for this meeting: https://ucdavis.zoom.us/meeting/register/tJUlce-pqz4oGNMZKMCyCXN-eNSY2Vf6aPYn
After registering, you will receive a confirmation email containing information about joining the meeting.