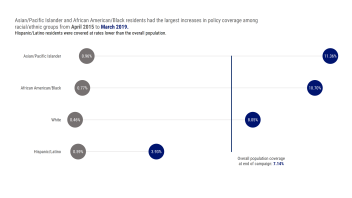
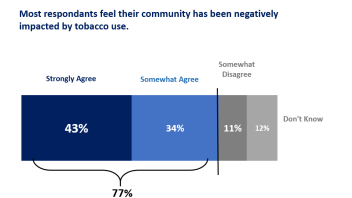
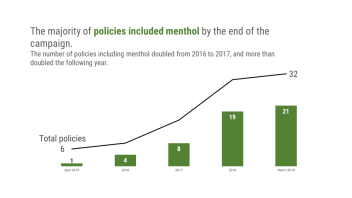
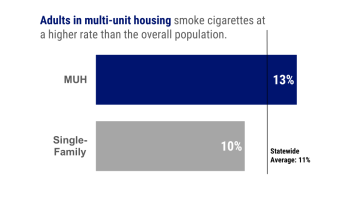
This page provides examples of the types of visualizations that can be created with both quantitative and qualitative data. Click on a photo for a more detailed description of the type of data used for each visualization.
To learn how to create vizualizations like the ones you see here, please visit our page on creating data viz for instructions, sample data sets, and more.
Photo(s)


