



And There Was Much Rejoicing!
In addition to the holidays, you’ve got a very good reason for rejoicing. The Tobacco Control Evaluation Center is excited to launch a brand-new resource created just for you: the Data Viz Idea Lab—a collection of over 50 data visualization and graphic design templates and examples that you can adapt for your own needs.

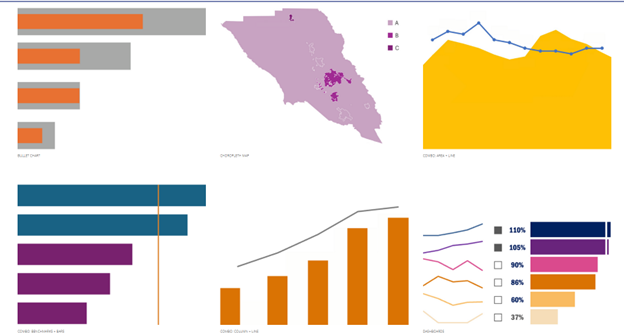
The Data Viz Idea Lab was designed to save you time, help fill gaps in data visualization expertise, and improve your effectiveness to communicate key messages with data. When you select a viz, the related page includes an example of the viz type, a brief explanation of when you might want to use it, a downloadable Excel or PowerPoint file, and a description of what is included in the file (some have multiple visualizations!) along with the Search Tags to help you quickly find similar viz types.

Beyond the individual pages devoted to each viz type, the site offers resources to familiarize (or refresh) users with the benefits of using data visualization, design principles that make for effective visualizations, instructions for searching the site, and links to external blogs, trainings, and other data viz tools.

But wait, there’s more! Under the Data Viz Basics tab, you’ll also find recordings from TCEC’s recent four-part virtual training series, Creating Effective Data Visualizations. If you missed a session (or want a refresher), this is a great place to start exploring.
We can’t wait for you to dig in and start creating on your own. Happy visualizing!
To access the Data Viz Idea Lab, visit https://datavizidealab.ucdavis.edu/. If you have questions or encounter any bugs, please reach out to us at [email protected]!